Dear Linux SysAd Blog Readers,
To all my subscribers and readers, I do appreciate all your time reading my feeds from time to time. Thank you for all the comments, shouts, and emails that I have been receiving too. I also appreciate the nice chillers, stumblers and community diggers you have been contributing up until now. Those backlinks, blogrolls, relinks that you are sharing from your sites, I managed to have 268 feed readers and subscribers which started from 1st of July 2007 up to this date, I thank you for all that.
...
Honestly, now my mind suddenly just warped back into the black hole and forgot what to blog.
So I went back to my old Gmail and randomly selected one of my emails for today. And decided to publish this particular email:
~~~~~~~~~~~~~~~~~~~~~~~~~~~~~~~~~~~~~~~~~~~~~~~~~~~~~~~~~~~~~~~~~~~~~~~~~~~~~~~~~~~~~~~~~~~~~~~~
Hi I came across your blog
http://ilovetux.com/2007/08/create-your-own-linux-os-distro-howto.html
I got the information exactly that I was searching ,I need some more information in case you know some thing then tell as per the instructions given on the revisor it is possible to create a distribution based on fedora I want to know is there any way this creation of DVD can be done without using revisor ,actually I want to understand this process of creation of installation media or ISO for my own customised linux tell me some keywords that I should look in for google
I don't want to use revisor that way I wont be able to know what exactly revisor did to create the installation media similar tool exist for Suse that is Kiwi
http://liquidat.wordpress.com/2007/06/22/kiwi-opensuses-re-spin-creator/
http://en.opensuse.org/KIWI
I am a learner and not much experienced in programming give me some links that might be relevant or google keywords to look in for .
~~~~~~~~~~~~~~~~~~~~~~~~~~~~~~~~~~~~~~~~~~~~~~~~~~~~~~~~~~~~~~~~~~~~~~~~~~~~~~~~~~~~~~~~~~~~~~~~
Sure, I gladly replied him back with
~~~~~~~~~~~~~~~~~~~~~~~~~~~~~~~~~~~~~~~~~~~~~~~~~~~~~~~~~~~~~~~~~~~~~~~~~~~~~~~~~~~~~~~~~~~~~~
if you want to build your own custom linux, the best reply i can give to you right now is to use google to search for
linux from scratch
do let me know if you plan to publish your new linux ISO, i would love to download it and watch it grow from distrowatch.org too :)
thanks for visiting my site, i appreciate your support.
~~~~~~~~~~~~~~~~~~~~~~~~~~~~~~~~~~~~~~~~~~~~~~~~~~~~~~~~~~~~~~~~~~~~~~~~~~~~~~~~~~~~~~~~~~~~~~
Again, I may not have all the time blog posting here, there, check spell that and this, and replying back to all your email requests, queries, comments due to some *time constraints but am still around here, working and blogging the alternative way, trying to have them one at a time and publish them one by one. I may not post from time to time but will do sooner or later.
Linux had invited us into one common IT place of linux advocacy and interests regardless of age, sex, religion, cultures, desktop and servers specs. I am glad to see that linux community had grown tremendously and still growing every day, well done.
Hope you stay tuned and see more of your visits from time to time.
Thanks for reading.
Cheers,
VeRTiTO
Get Fedora

Tuesday, September 25, 2007
Dear Linux SysAd Blog Readers
Proactive monitoring from linux terminal
As I was watching several google search keywords being used by most site visitors around this linux blog, I noticed several search keywords that led most users into this site
One of the recent google keyword search from CA,USA was:
~~~~~~~~~~~~~~~~~~~~~~~~~~~
linux watch ls directory
~~~~~~~~~~~~~~~~~~~~~~~~~~~
with equivalent google search URL:
google search keyword
and in turn, google replied with this URL
from one of my Linux SysAd blog entries as you can see.
However, the returned URL is about ls command usage but not watching directory and files proactively from display screen. Yes, it is somehow related but needs more command tweaking and another linux command.
So, I am creating this blog entry for monitoring directory and files proactively live from your display screen via command line terminal.
Here's several ways on how to watch live directory/files changes from your display screen.
Fire up your first terminal and issue
# cd /tmp
# watch ls -C
Then fireup your second terminal and issue the commands below
# cd /tmp
# touch A1
# touch A2
# touch Z1
During the creation of A1, A2, Z1 files using linux touch command, you need to switch and focus your screen display with the terminal which was first launched.
Here's a way to watch them change on the fly sorted by ctime or creation timestamp.
From the first terminal, issue
# watch ls -Cc
By default, 'watch' linux command refreshes every 2 seconds. You can modify it using -n watch parameter like so
# watch -n 0 ls -CC
which waits for 0.1 seconds for file changes to be displayed out from your screen terminal.
If you are only interested to file changes owned by user vertito, simply
# watch -n 0 'ls -Cc | grep vertito'
Note:
1. printing characters are being stripped by watch linux command
2. any terminal resize would not do screen repaint automatically but after the next watch update
Now, to watch your ethernet TX/RX packets from ethernet device using watch, simply
# watch -n 0 ifconfig eth0
The above is like the command line version of NIC network general properties in windoze. You can also use these when troubleshooting network card and ethernet link connectivity issues or any network congestion issue from your current broadcast network.
If somebody is transferring FTP files into one of your managed host or partition, or an external host is uploading large files into your shared SAMBA folder and you want to watch your current disk/partition space usage proactively while the transfer is occurring, simply
# watch -n 0 df -ah
# watch -n 0 du -sh
To watch your host memory and swap resources proactively using watch
# watch -n 0 free
# watch -n 0 cat /proc/swaps
partially similar to top linux command.
To watch your queued mail proactively from terminal (postfix or sendmail), simply
# watch -n 0 mailq
I guess I have monitored and reacted proactively from my blog site as well because of this entry name.
There's a lot more live monitoring of logs and statistics that can be combined with watch linux command, you can create your own combination of linux command and shell scripts too!
That's all folks, enjoy, thanks for the black box tip!
deleting new lines and return line from text file
How to delete new lines and return key characters from text file?
How to delete backspace and formfeed characters from text file?
How to delete horizontal tab and vertical tab character from text file?
How to remove backslash from text file?
How to delete specific set of characters from text file?
A sample text file.
# cat testfile.txt
~~~~~~~~~~~~~~~~~~~~~~~~~~~~~~~~~~~~~~~~~~~~~~~~~~~~~~~~~~~~~
The quick brown fox blogs over the Linux SysAd.
The quick brown fox blogs over the Linux SysAd.
~~~~~~~~~~~~~~~~~~~~~~~~~~~~~~~~~~~~~~~~~~~~~~~~~~~~~~~~~~~~~
To delete new lines and empty lines from text file
# tr -d '\n' < testfile.txt
How to delete backspace and form feed characters from text file?
# td -d '\b' < testfile.txt
# td -d '\f' < testfile.txt
# td -d '\b\f' < testfile.txt
How to delete horizontal tab and vertical tab character from text file?
# td -d '\t' < testfile.txt
# td -d '\v' < testfile.txt
# td -d '\t\v' < testfile.txt
How to remove backslash from text file?
# cat testfile.txt
~~~~~~~~~~~~~~~~~~~~~~~~~~~~~~~~~~~~~~~~~~~~~~~~~~~~~~~~~~~~~
The quick brown fox blogs over the Linux SysAd.
\
\\
\\\
The quick brown fox blogs over the Linux SysAd.
~~~~~~~~~~~~~~~~~~~~~~~~~~~~~~~~~~~~~~~~~~~~~~~~~~~~~~~~~~~~~
# td -d '\\' < testfile.txt
~~~~~~~~~~~~~~~~~~~~~~~~~~~~~~~~~~~~~~~~~~~~~~~~~~~~~~~~~~~~~
The quick brown fox blogs over the Linux SysAd.
The quick brown fox blogs over the Linux SysAd.
~~~~~~~~~~~~~~~~~~~~~~~~~~~~~~~~~~~~~~~~~~~~~~~~~~~~~~~~~~~~~
How to delete specific set of characters from text file?
# cat testfile.txt
~~~~~~~~~~~~~~~~~~~~~~~~~~~~~~~~~~~~~~~~~~~~~~~~~~~~~~~~~~~~~
The quick brown fox blogs over the Linux SysAd.
The quick brown fox blogs over the Linux SysAd.
~~~~~~~~~~~~~~~~~~~~~~~~~~~~~~~~~~~~~~~~~~~~~~~~~~~~~~~~~~~~~
# tr -d '=aeiou=' < testfile.txt
~~~~~~~~~~~~~~~~~~~~~~~~~~~~~~~~~~~~~~~~~~~~~~~~~~~~~~~~~~~~~
Th qck brwn fx blgs vr th Lnx SysAd.
Th qck brwn fx blgs vr th Lnx SysAd.
~~~~~~~~~~~~~~~~~~~~~~~~~~~~~~~~~~~~~~~~~~~~~~~~~~~~~~~~~~~~~
For more string and character manipulation of text file, read more tr arguments from here.
Saturday, September 22, 2007
Google chat setup using PSI howto
Related to my previous entry here, here's another blog entry on configuring your Google mail account to do Google Talk/Chat with your friends without having logging into your GMail (Google Mail) account from any internet browser.
PSI INSTALLATION STEPS:
~~~~~~~~~~~~~~~~~~~~~~~
Here are five easy steps on how to setup your PSI messenger to connect to Google Talk/Google Chat servers.
If you have not installed PSI yet, visit this link. Assuming you have successfully installed yum, follow the below easy installation steps and screenshots guides.
1. Launch PSI messenger. Click Account Setup as shown below.
2. Click Add button, enter your Google Chat Name to identify the PSI Group. Followed by your Gmail Account name or your GMail email address as shown below. Click Save.

3. Make sure you check the below similar option boxes. Enter talk.google.com as your connection server. Enter the same port number as shown below.
4. From PSI main menu, choosing Online would start and connect your PSI to the net. Click and enabble the PSI group name.
Clicking Online would prompt your for your GMail account password, enter as required.

PSI would then retrieve your existing GMail friends and contact from talk.google.com server. PSI would then display all your online and offline users from here.
Congratulations!!! You are now online with Google Talk using PSI messenger.
For more PSI info, visit PSI site here.
HTH.
Cheers
Related Posts:
How To See Invisible YM Users
How To Setup Chikka SMS Messenger using Kopete Messenger
How To Setup Chikka SMS Messenger using GAIM Pidgin
How To Block YM Messenger
How To Install GAIM Pidgin Messenger
How To Install KDE Kopete Messenger
How To Install AMSN Messenger
How To Setup and Install PSI Chat Messenger
PSI messenger - a truly promising open messaging application
In the Open Source world, linux gives us more freedom and alternatives on achieving things from simple to complex technical server and dsektop issues. Linux applications does not confine us into one corner spot of the room and learn from that corner spot alone all time through. Linux open source applications expands your knowledge from your own stand point of interest supported by worldwide community and not from a commercially grown application interests.
Here's another entry on how to install PSI on Fedora
What is PSI?
~~~~~~~~~~~~
This is the best description I could have from PSI application, a well defined description and application usage from both developer and user's stand point of view.
PSI description:
(lifted from PSI site)
Psi is the premiere Instant Messaging application designed for Microsoft Windows, Apple Mac OS X and GNU/Linux. Built upon an open protocol named Jabber, Psi is a fast and lightweight messaging client that utilises the best in open source technologies.
The goal of the Psi project is to create a powerful, yet easy-to-use Jabber/XMPP client that tries to strictly adhere to the XMPP drafts and Jabber JEPs. This means that in most cases, Psi will not implement a feature unless there is an accepted standard for it in the Jabber community. Doing so ensures that Psi will be compatible, stable, and predictable, both from an end-user and developer standpoint.
This does not mean that Psi will never have "cool new features". The dev team and community are power-users who look to Psi to keep up with the times. We always want to hear what the users of Psi would like, and if a feature that the dev team wishes to implement does not have an accepted standard, or would diverge from an existing one, we can work together to see the standards changed to accomodate everyone.
PSI INSTALLATION USING YUM:
~~~~~~~~~~~~~~~~~~~~~~~~~~~~
# yum -y install psi psi-i18n psi-icons
APPLICATION LAUNCH:
~~~~~~~~~~~~~~~~~~~
# psi
Perhaps you have been considering Jabber, but don't want to abandon your friends? Jabber technologies are highly extensible, so Psi is able to interoperate with other, proprietory messaging systems such as AOL's ICQ and Microsoft's Messenger. You can keep in contact with your friends, regardless of whether they use AIM, ICQ, MSNM or YM. It's even possible to use Internet Relay Chat! *
Unlike other IM clients, Psi is small, fast and responsive. It uses a graphical toolkit called Qt, which takes on the appearance of whichever operating system you run it on. For this reason, Psi doesn't use 'skins'. We'd rather it blend with your desktop like any other application.
PSI Screenshots:


Final Note:
~~~~~~~~~~~
PSI internet chat messaging works smoothly with KDE and GNOME. PSI has extensive features available at its early age. PSI presents these features in user friendly appearance schemes systematically done, avoiding complex program menu structures and program options. This approach makes PSI messenger fun and easy to use. PSI is on its early version state yet but had already established as a true and very promising open internet messaging application.
So watch out for PSI growth. Enjoy!
Related Posts:
How To See Invisible YM Users
How To Setup Chikka SMS Messenger using Kopete Messenger
How to Install and Setup Google Chat Messenger
How To Setup Chikka SMS Messenger using GAIM Pidgin
How To Block YM Messenger
How To Install GAIM Pidgin Messenger
How To Install KDE Kopete Messenger
How To Install AMSN Messenger
Google chat setup using GAIM Pidgin howto
As per request, here's an entry that shows how to setup your Pidgin GAIM to use your Google Talk or GMail account.
Pidgin man:
Pidgin is a graphical modular messaging client based on libpurple which is capable of connecting to AIM, MSN, Yahoo!, XMPP, ICQ, IRC, SILC, SIP/SIMPLE, Novell GroupWise, Lotus Sametime, Bonjour, Zephyr, Gadu-Gadu, and QQ all at once. It is written using GTK+.
FIVE EASY STEPS:
~~~~~~~~~~~~~~~~
1. Make sure you have the latest pidgin software. To upgrade your current GAIM application using Fedora yum, simply connect to the internet and issue
# yum -y upgrade gaim
2. Make sure you already have an existing GMail account. Launch Pidgin GAIM software. Add a new your GMail account by clicking Account menu from GAIM and selecting Add from one of the dropdown menu.
3. A new Add Account window would appear. Click Add button. Simply select Google Talk from one of the Protocol dropdown selections. Complete the other required fields like screen name and password as shown below. Remember to click the Save button.
4. Now, back to pidgin window, press Ctrl+A keys to view all your Pidgin current account settings. A new Account window will appear. From the list being shown from your screen, you should be able to see your newly added Google Chat Pidgin account that makes use of XMPP protocol.
5. To start using Google chat from Pidgin, simply check or tick the Enabled tick box from the leftmost part of your Google chat account and enter your password when prompted. From here, you can starting adding your GMail friends and contacts.
Enjoy!
For more pidgin info, visit here.
Friday, September 21, 2007
Linux command line shell variables defined
Reading daily doze of linux commands makes our memory to remember their command usage and command scopes. Doze of commands refreshes part of our linux brain to easily apply simple but useful linux commands when needed. Remembering those thousand of commands is not really an easy task specially most linux commands are not being used and applied on our daily linux work routines.
Here are a few doze of linux shell variables that might be helpful and useful to some bash shell scripting.
Usually, when creating shell scripts, we make use of user input variables or command line parameters that server as input arguments to shell commands or shell executable scripts. Using these variables provides us a way to determine shell program function execution and directly reference a submitted command line parameters.
Below are several linux bash variables that we can integrate when parsing user-input command line parameters.
$$
The above linux shell variable can be used to display and fetch current PID number of the current shell script.
How to know your current shell PID number from command line?
# echo $$
~~~~~~~~~~~~~~~
25341
~~~~~~~~~~~~~~~
Usage Application:
~~~~~~~~~~~~~~~~~~
On terminating and remembering the PID number of the current running shell program. A sample shell script usage of the above command would be
~~~~~~~~~~~~~~~~~~~~~
#/bin/bash
echo Current PID: $$
~~~~~~~~~~~~~~~~~~~~~
Next linux shell variable
When terminating a function, a proper way to determine if a function script had terminated properly is to determine its script exit code or status. This can be done by using the below linux shell variable
$?
Usage Application:
~~~~~~~~~~~~~~~~~~
When doing function or disk/file operations, or even executing another shell script, we can make use of this linux shell variable as shown below, which prints the exit code status of test_function
after finishing some stuff operations shown below.
~~~~~~~~~~~~~~~~~~~~~~~~~~~
#/bin/bash
function test_function {
# do some stuff
echo Function Exit Code $?
}
# call the function
test_function
~~~~~~~~~~~~~~~~~~~~~~~~~~~
Next linux variable
$0
This variable displays how the current shell program is being called. This could refer also the current path location where the program has been executed. We can also make use of this to test for any filename changes with the shell and/or any changes with the working folder of the file executable to verify if the current working folder or filename had been tampered or changed.
Usage Application:
~~~~~~~~~~~~~~~~~~
The below script checks if the script is being called from /tmp and the script name is test.sh
# cat /tmp/test.sh
~~~~~~~~~~~~~~~~~~~~~~~~~~~~~~~~~~~~~~~~~~~~~~~~~~~~~~~~~~~~~~~~~~~~~~~~
#/bin/bash
echo $0
if [ "$0" = "/tmp/test.sh" ]; then
echo "Good starting folder and still the same shell filename"
else
echo "Alert: Script Name and/or source folder changed!"
fi
~~~~~~~~~~~~~~~~~~~~~~~~~~~~~~~~~~~~~~~~~~~~~~~~~~~~~~~~~~~~~~~~~~~~~~~~
Next linux command variable would be
$1
$2
The above linux shell variable refers to arguments or parameters being passed to current shell script:
Usage Application:
~~~~~~~~~~~~~~~~~~
# cat test.sh
~~~~~~~~~~~~~~~~~~~~~~~~~~~~
#/bin/bash
echo Parameter No. 1: $1
echo Parameter No. 2: $2
~~~~~~~~~~~~~~~~~~~~~~~~~~~~
# ./test.sh firstname secondname
~~~~~~~~~~~~~~~~~~~~~~~~~~~~~~~~~~~~
Parameter No. 1: firstname
Parameter No. 2: secondname
~~~~~~~~~~~~~~~~~~~~~~~~~~~~~~~~~~~~
The above variable applies also to Nth variable.
The next linux shell variable:
$*
The above refers to all parameters or arguments passed with the current shell script
Usage Application:
~~~~~~~~~~~~~~~~~~
# cat test.sh
~~~~~~~~~~~~~~~~~~~~~~~~~~~~
#/bin/bash
echo Parameters Passed: $*
~~~~~~~~~~~~~~~~~~~~~~~~~~~~
# ./test.sh Linux SysAd Blog
~~~~~~~~~~~~~~~~~~~~~~~~~~~~~~
Parameters Passed: Linux SysAd Blog
~~~~~~~~~~~~~~~~~~~~~~~~~~~~~~
Passing variables makes it easy for varying input arguments for a shell script. This approach flexes input entries for specific shell script. It can also be used to trigger shell functions and shell program directions as well.
Now, the below command refers to the total number of command line parameters or argument passed together with the shell script
$#
Usage Application:
~~~~~~~~~~~~~~~~~~
# cat test.sh
~~~~~~~~~~~~~~~~~~~~~~~~~~~~~~~~~~~~~~~~~~~~~~~
#/bin/bash
echo Number of Parameters supplied: $#
~~~~~~~~~~~~~~~~~~~~~~~~~~~~~~~~~~~~~~~~~~~~~~~
# ./test.sh I have only 5 parameters.
~~~~~~~~~~~~~~~~~~~~~~~~~~~~~~~~~~~~~~~~~~~~~~~
Number of Parameters supplied: 5
~~~~~~~~~~~~~~~~~~~~~~~~~~~~~~~~~~~~~~~~~~~~~~~
Another shell variable is
**
This shell variable when used displays all files and directory folders located from where the shell script was called.
Usage Application:
~~~~~~~~~~~~~~~~~~
# cat test.sh
~~~~~~~~~~~~~~~~~~~~~~
#/bin/bash
echo **
~~~~~~~~~~~~~~~~~~~~~~
Looks useless but serves its purpose when used well.
Here's a tip:
Pressing ESC+* from command line list down all available binaries from current PATH variable of current box which the current user can make use of.
Final Note:
~~~~~~~~~~~
These linux shell variable can be handy when creating varying input arguments with your shell scripts. Making use of these variables creates convenience on passing parameters to a shell script.
Redirecting shell program direction when using these variables would then be easier assuming a single shell script that does two (2) different functions. Simply pass a trigger word that would redirect the shell program to call for a particular shell function defined inside that script like so:
# ./test.sh trigger2
That does the linux shell task as expected.
Happy weekend!
ls - displaying directory contents in many ways
Here goes another tutorial that would uncover samples of using the most commonly used linux command using the command line terminal.
This linux blog entry covers the tutorial of using one of the simplest command line in linux terminal.
LS Tutorial - Display Files and Folders in Linux
ls is a linux command that is basically being used from command line terminal to list down directory contents. Directory contents can are linux files, it can be typical directory files, special files, directories, hard and soft links or any other device contents.
File items and directory folders are usually the contents of current working folder. Linux directory usually contains folder locations the probably contains zero or more files inside it, while linux files are files, hard or soft links to files or device that contains zero or more data contents when viewed or referenced from.
Here are more ls samples that might be helpful on learning this ls command.
How to list down all files and directory folders of current working directory.# ls
How to list down all files and directories using ls a short format form
# ls -a
How to list down all files and directories using ls a short format form# ls -la
Using the above two commands shows linux files and folders. In a long format, ls shows directory contents with their corresponding file attributes and file ownership and permissions, date/time stamps and filesize .
Most linux distro uses command aliases.
To print the current alias for ls, simply# alias ls
Using the above command would show the current ls alias and ls parameters when issued directly from the command line. This goes to any other linux command aliases.
To continue with ls command, here's how to list down all directory contents excluding . and .. in a short ls form# ls -A
Combining the previous two commands of using ls to show the long format form and all directory contents but without . and ..# ls -Ala
To list down directory contents in a more human readable form showing sizes like 1K, 2M 3G file sizes# ls -h
# ls -hal
# ls -halA
To list down directory contents without showing ownership and group names would be done respectively like so# ls -aG
# ls -aGg
To list down directories and folders only in ls short form# ls -d */
To list down directories and folders only in ls long form would be# ls -dl */
To list down directories and folders start starts with d displayed in ls short form would be# ls -d d*/
To list down directories and folders start starts with d displayed in ls long form would be# ls -dl d*/
ls always shows directory contents in a colored ls alias fashion. To ignore and display directory contents without screen colors would be
# ls -la --color=never
To list down directory contents with reverse matching pattern and hide a specified patterns from being displayed would be# ls --hide=v*
# ls --ignore=v*
The above list down all directory contents except the ones that starts with the letter v
To list down directory contents with numeric user and group IDs using ls would be# ls -n
To list down directory contents with index number of each item would be# ls -lai
To list down directory contents showing also the link reference rather than the link itself would be# cd /dev
# ls -laL
To list down directory contents recursively would be# ls -R
To list down directory contents sorted by modification time would be
# ls -t
# ls -lat
The default ls tab stop is 8, if you want to customize the ls tab stop, simply specify it like so# ls --tabsize=16
To list down directory contents separated by comma in a short ls form would be# ls -m
To reverse the sort ordering display of directory contents using ls would be
# ls -r
# ls -lar
HTH
Thursday, September 20, 2007
Control of alternative linux executables
Here are simple tips on controlling which executables would be executed by your linux box when issued from command line terminal.
There are several ways to specify and control which binary executable file or linux shell command would be executed by your system when issued from the terminal.
SCENARIO APPLICATION
~~~~~~~~~~~~~~~~~~~~
This blog entry assumes the possible scenarios relating to this linux blog entry:
a. you just resume to your new job with these linux boxes and you found out that some binaries were installed manually from tar ballz (tar.gz) and some were from rpm (rpm) binary package installer
b. the linux box uses both opensource binary package version and the package distributed by commercial company, like for Java binaries.
c. a previous sysad created an executable with an exact filename similar to linux built-in commands.
d. simply you want to know specify which binary executables you want to execute
Let us assume that we currently have two binary executable files named nagios, which are currently located from two different location ofcourse.
# which dir
/usr/bin/nagios
/usr/local/bin/nagios
Here are some alternative approach on how to specify which binary file location to go into when executing a linux binary or executable file.
First scenario approach
~~~~~~~~~~~~~~~~~~~~~~~~
Be in charge of your linux bash environment. This includes setting all the needed environment variables into your desired needs. Reordering of default PATH shell environment from current user account is also advisable .
# echo PATH
Considering the two binary nagios path locations
/usr/bin/nagios
/usr/local/bin/nagios
And assuming you want your system to look first for /usr/local/bin/, simply specify and change your system PATH environment variable and make sure /usr/local/bin comes first before /usr/bin before executing the duplicated binary executable like so
# export PATH=/usr/local/bin:/usr/bin
# nagios
Second scenario approach:
~~~~~~~~~~~~~~~~~~~~~~~~~
Make use of linux command name aliasing. Linux bash aliases can be instructed to remember a particular path location when executing a specific linux command. This also applicable to specify further binary arguments when calling a default binary executables.
# alias nagios='/usr/local/bin/nagios'
# nagios
To specify additional argument for a binary
# alias nagios='/usr/local/bin/nagios --whatever'
# nagios
To print all linux aliases and verify the above specifed binary path location alias
# alias
~~~~~~~~~~~~~~~~~~~~~~~~~~~~~~~~~~~~~~
alias nagios='/usr/local/bin/nagios'
~~~~~~~~~~~~~~~~~~~~~~~~~~~~~~~~~~~~~~
Third scenario approach
~~~~~~~~~~~~~~~~~~~~~~~~~
Alternatives man definition:
alternatives creates, removes, maintains and displays information about the symbolic links comprising the alternatives system. The alternatives system is a reimplementation of the Debian alternatives system. Alternatives was rewritten primarily to remove the dependence on perl; it is intended to be a drop in replacement for Debian’s update-dependencies script.
It is possible for several programs fulfilling the same or similar functions to be installed on a single system at the same time. For example, many systems have several text editors installed at once. This gives choice to the users of a system, allowing each to use a different editor, if desired, but makes it difficult for a program to make a good choice of editor to invoke if the user has not specified a particular preference.
The alternatives system aims to solve this multiple executables issues by using symbolic links to specify default command location using linux command alternatives.
Now, to install and add both nagios alternatives to alternatives config choices, simply
# alternatives --config nagios
# alternatives --install /usr/local/bin/nagios nagios /usr/local/bin/nagios 1
# alternatives --install /usr/bin/nagios nagios /usr/local/bin/nagios 2
To view current nagios alternatives config
# alternatives --display nagios
To view and select which binary nagios binary for linux to execute when issued from CLI
# alternatives --config nagios
Alternatives prioritizes binary command execution using alternatives command as shown above.
Final Note:
~~~~~~~~~~~
As you can see, there are lot of alternative ways to approach an issue using linux tool sets. Linux is quite powerful specially on these scenario on customizing basic tool command sets up to custom made kernels, that is why OpenSource tools are quite powerful and would continue to be so.
HTH
Appreciate your visit here, thanks for the tip!
Searching using whereis linux command
Now, another simple linux command for locating binary, source and manual pages using whereis.
From recent linux 'which' blog entry, here is another way to find and locate the location and full path of a particular binary, man pages and sources of a given program argument. Whereis locates the binary from the standard linux binary locations.
Whereis man description says:
whereis locates source/binary and manuals sections for specified files. The supplied names are first stripped of leading pathname components and any (single) trailing extension of the form .ext, for example, .c. Prefixes of s. resulting from use of source code control are also dealt with. whereis then attempts to locate the desired program in a list of standard Linux places.
Whereis Usage and Explanation:
~~~~~~~~~~~~~~
# whereis cat
~~~~~~~~~~~~~~~~~~~~~~~~~~~~~~~~~~~~~~~~~~~~~~~~~~~~~~~~~~~~~~~~~~~~~~~~~~
cat: /bin/cat /usr/share/man/man1p/cat.1p.gz /usr/share/man/man1/cat.1.gz
~~~~~~~~~~~~~~~~~~~~~~~~~~~~~~~~~~~~~~~~~~~~~~~~~~~~~~~~~~~~~~~~~~~~~~~~~~
From the above result, Whereis shows
~~~~~~~~~~~~~~~~~~~~~~~~~~~~~~~~~~~~~~~~~~~~~~~~~~~~~~~
a. cat binary location is /bin
b. cat man and source pages are currently located in
/usr/share/man/man1p/c
/usr/share/man/man1/c
~~~~~~~~~~~~~~~~~~~~~~~~~~~~~~~~~~~~~~~~~~~~~~~~~~~~~~~
More Whereis Usage and Examples:
~~~~~~~~~~~~~~~~~~~~~~~~~~~~~~~~
To locate a binary or executables location only using whereis
# whereis -b cat
~~~~~~~~~~~~~~~~~~~~
cat: /bin/cat
~~~~~~~~~~~~~~~~~~~~
To locate and search from manual pages or section of a binary using whereis from terminal
# whereis -m cat
~~~~~~~~~~~~~~~~~~~~~~~~~~~~~~~~~~~~~~~~~~~~~~~~~~~~~~~~~~~~~~~~~
cat: /usr/share/man/man1p/cat.1p.gz /usr/share/man/man1/cat.1.gz
~~~~~~~~~~~~~~~~~~~~~~~~~~~~~~~~~~~~~~~~~~~~~~~~~~~~~~~~~~~~~~~~~
To limit the place where whereis would search location from
# whereis -B /sbin -b cat
which shows no result since we know that binary cat is located from /bin folder location and not /sbin which was specified above.
Now, here's another whereis example application
# cd /tmp
# touch cat
# ch700 cat
# whereis -B /tmp -b cat
result:
~~~~~~~~~~~~~~~~~
cat: /tmp/cat
~~~~~~~~~~~~~~~~~
# whereis abc123
# whereis cat echo
# whereis whereis
~~~~~~~~~~~~~~~~~~~~~~~~~~~~~~~~~~~~~~~~~~~~~~~~~~~~~~~~~~~
whereis: /usr/bin/whereis /usr/share/man/man1/whereis.1.gz
~~~~~~~~~~~~~~~~~~~~~~~~~~~~~~~~~~~~~~~~~~~~~~~~~~~~~~~~~~~
HTH
Witchy which linux command
Here's a simple linux command the give you the full path of of linux binary or executable command.
Which definition:
~~~~~~~~~~~~~~~~~~
Which Linux command shows the full path of any binary or shell command when executed. Which does the full patch searching by looking from the linux environment PATH variable. Which command can take one or more argument for processing. This 'which' linux comamnd follows the command line format as shown below:
which command1 command2
To list out your PATH environment variable from command line
# echo $PATH
Alternatively, you can grep PATH variable from your current environment shell like so
# set | grep PATH
Which Usage
~~~~~~~~~~~
Let us assume that you have a command named fixit that was installed from tar ball (tar.gz) and from rpm package (rpm). On which, fixit was probably installed into /usr/bin and /usr/local/bin .
To execute the command, simply issue
# fixit
The problem with this command is you don't know which binary has been executed by the system.
One way of resolving this issue is using which linux command by doing so
# which fixit
which then tells you which binary would be executed if fixit was issued from ther terminal. Which linux command also tells your the full path location of the command argument.
Final Which Note:
~~~~~~~~~~~~~~~~~
Using which, you can then know where would be the binary path location is when a command or executable shell would be executed. Which linux command is installed in Fedora by default system tools installation.
More which command line examples:
~~~~~~~~~~~~~~~~~~~~
# cd /home/me
# chmod 700 fixme
# which ./fixme
~~~~~~~~~~~~~~
/home/me/fixme
~~~~~~~~~~~~~~
# which which
~~~~~~~~~~~~~~~~~~~~~~~~~~~~~~~~~~~~~~~~~~~~~~~~~~~~~~~~~~~~~~~~~~~~~~~~~~~~~~~~~~~~~
alias which='alias | /usr/bin/which --tty-only --read-alias --show-dot --show-tilde'
/usr/bin/which
~~~~~~~~~~~~~~~~~~~~~~~~~~~~~~~~~~~~~~~~~~~~~~~~~~~~~~~~~~~~~~~~~~~~~~~~~~~~~~~~~~~~~
# cd /tmp
# touch cat
# chmod 700 cat
# which ./cat
~~~~~~~~~~~~~~~~~~
/bin/cat
~~~~~~~~~~~~~~~~~~
# which echo dir
~~~~~~~~~~~~~~~~~~~~~~~~~~~
/bin/echo
/usr/bin/dir
~~~~~~~~~~~~~~~~~~~~~~~~~~~
HTH
Tuesday, September 18, 2007
NeroLinux - diehard Nero burning software
For die-hard Nero burning software fans, Nero burning software also comes in Linux.
Nero Linux is a flexible application, which supports all important features of Nero Burning ROM on Linux Systems.
From Nero site:
Nero Linux 3 is the definitive burning application for the Linux operating system. Based on the award-winning Nero Burning ROM 7 platform, Nero Linux 3 is the most powerful and versatile burning application available for Linux, and the only application to offer Blu-ray Disc and HD DVD data burning support.
Main Nero for Linux features:
* Enjoy the same functionalities as in Nero Burning ROM 7
* Burn data using any optical disc format, including CD, DVD, Blu-ray Disc, and HD DVD
* Ensure a quick and easy setup using SmartDetect automatic drive support
* Take control of your music collection with integrated audio capabilities including high speed digital audio extraction and FreeDB to automatically obtain disc information over the internet
Nero Linux is able to burn the following formats:
- Data CDs and DVDs (using ISO9660, UDF and UDF/ISO9660 Bridge)
- Data HD DVDs and Blu-Ray discs (UDF)
- Bootable CDs/DVDs using the El-Torito standard
- Audio CDs from various audio formats
- Mixed-Mode CDs and Enhanced CDs (CD EXTRA)
- Disc Images (ISO, NRG and Cue Sheets)
- DVD-Video and miniDVD
- Multisession discs
NeroLinux also uses the embedded API from the widely used Nero burning software for windows. Another good thing about Nero's burnign software is simple but thourough application guide that comes from the installer which is also available from the web. If you wish to know more of its documentation and application operation, you can visit them here.
NERO FOR LINUX INSTALLATION:
============================
If you wish to give NeroLinux a try, download the rpm package NeroLinux in full trial version from here.
After downloading the package, simply use the rpm binary installer to install the package like so:
# rpm -ivh nerolinux-3.0.1.3-x86.rpm
NEROLINUX APPLICATION LAUNCH
============================
# nero
NeroLinux works in Fedora, see my own screenshots:
The first two initial screenshots would be prompted after a fresh installation.

Now, here comes my selection of files of data burning.

Yes, it is a full Nero for Linux version that offers a full feature Nero burning software in 30 days trial mode!
HTH
All products, trademarks, and companies mentioned here are all managed by their own respective owners and/or companies.
Monday, September 17, 2007
Google Sky - Explore and Rediscover the Sky
Now, I have a chance to post a 3D rendering related linux blog entry here that explores more of the Stars and Sky using Google Earth.
Three weeks ago, Google launched the latest addition and highlight features with Google Earth. The feature addons is being called Google Sky and is part of Google Earth version 4.2.
Google Sky button is available from one of the top menu palen from Google Earth application. Google Sky is referreing name on visualizing stars and galaxy using Google Earth. Impressively, this Google Sky enables you to visit any stars and galaxies around the universe, as if they are near you and you were travelling faster than the speed of light!
Google Sky also allows you to select from several variety of constellations, stars, planets, moon, galaxies, astronomy, and more technical info of current view such as object distance, size, diameter, history and life of the galaxy object being viewed.
GOOGLE EARTH INSTALLATION
=========================
Download the latest Google Earth from here.http://earth.google.com/download-earth.html
For more Google Sky info and feature flash demo, visit the site from here http://earth.google.com/sky/skyedu.html
After downloading GoogleEarthLinux.bin, simply
# chmod 700 GoogleEarthLinux.bin
# ./GoogleEarthLinux.bin
GOOGLE EARTH BINARY LAUNCH:
===========================
# googleearth
More Google Sky Video/Audio Brief Demo:
~~~~~~~~~~~~~~~~~~~~~~~~~~~~~~~~~~~~~~
My own Google Sky screenshot using Google Earth:
~~~~~~~~~~~~~~~~~~~~~~~~~~~~~~~~~~~~~~~~~~~~~~~~


Watch a Fascinating Google Sky Video Demo from YouTube files:
~~~~~~~~~~~~~~~~~~~~~~~~~~~~~~~~~~~~~~~~~~~~~~~~~~~~~~~~~~~~~
If you can run Google Earth from your desktop, you can also run Google Sky pretty well.
I am giving the latest version of Google Earth and Google Sky feature an additional 5/5 feature rating!
Well done Google guys!
All trademarks and products mentioned here are all managed by their own respective company and owners.
Celestia - 3D Earth and Sky visualization
Here's another linux application that that lets you explore the sky, planets, stars, galaxy and universe in three dimensions (3D), also an alternative for MS Visual Earth.
Celestia is a real-time space simulation which lets you experience the universe in three dimensions. Celestia does not confine you to the
surface of the Earth only, but Celestia allows you to travel throughout the entire solar system, to any of over 100,000 stars, or even beyond the galaxy.
The Celestia has several features, one of them is exponential zoom feature that lets you explore space and galaxies across a huge range of scales and from galaxy clusters down to spacecraft only a few meters across. A 'point-and-goto' interface makes it simple to navigate through the universe to the object you want to visit, all these are displayed seamlessly in 3D rendered graphical display from GNOME or KDE.
Celestia is expandable. Celestia comes with a large catalog of stars, galaxies, planets, moons, asteroids, comets, and spacecraft. If that's not enough, you can download dozens of easy to install add-ons with more objects.
I have successfully installed Celestia from my intel-based motherboard and video adapter. And I have to say the 3d graphics was rendered by Celestia in an impressive seamless way making use of my 3d-enabled intel based vga adapter.
CELESTIA INSTALLATION
=====================
Celestia can be installed from Windows, Linux, and Mac OS X. Celestia is available also from Fedora 7 repos. The Fedora installation is very simple, as always.
# yum -y install celestia
This would download and install an approximate 18MB of package file.
CELESTIA BINARY LAUNCH:
======================
# celestia
My Celestia screenshots:
~~~~~~~~~~~~~~~~~~~~~~~~


Celestia webshots:
~~~~~~~~~~~~~~~~~~
For more documentation, you can visit here and addons documentation from here. And for more download platform/distro download, visit them here.
Enjoy the skies.
Earth3D - real-time 3D Earth visualization
Here's a linux alternative to Microsoft Visual Earth.
Earth3D is a linux application for visualizing the earth in realtime 3D view. Earth3D displays the recent satellite images and map data into your display screen live via data streaming using data servers from NASA, USGS, the CIA and the city of Osnabrück. This Earth3D application is available from many OS platforms like Linux, MacOS X and Windows and is under the GPL license.
Earth3d Main Features:
~~~~~~~~~~~~~~~~~~~~~~
* viewing the earth globe as a whole
* zooming with selected countries like Germany for now
* embedding external data like current earthquake positions or cloud data
Hardware Requirements:
~~~~~~~~~~~~~~~~~~~~~
Earth3D application uses OpenGL and QT to view the earth globe map. Earth3D downloads the texture and heightfield data on demand over the internet. You need at least DSL speed (about 768kbit) to use it. Earth3D was was tested from Athlon 850Mhz with an Nvidia Geforce 2 MX and from my Intel-based motherboard with built-in Intel-based display adapter/controller.
EARTH3D INSTALLATION:
=====================
As of this writing, the only available rpm package of Earth3D for Fedora distro is designed for Fedora Core 2. To install Earth3D in Fedora 7 using this version, you can download the rpm package for Fedora Core 2 from here.
# wget -c "http://newrpms.sunsite.dk/apt/redhat/en/i386/fc2/RPMS.newrpms/earth3d-1.0.1-1.rhfc2.nr.i386.rpm"
I have installed the FC2 rpm package successfully into my Fedora 7 without any issues. You've been warned that the binary rpm package was designed for Fedora Core 2. To install it into Fedora 7, simply
# rpm -ivh earth3d-1.0.1-1.rhfc2.nr.i386.rpm
If you want to see more download package for other linux distros, check the link from here.
BINARY EXECUTION:
~~~~~~~~~~~~~~~~~
Ctrl+F2, earth3d
Here's a sample screenshot that I had after installing Earth3D.

For FAQS and further readings, see more from here.
HTH
All products and companies mentioned here are all trademarks and managed by their own respective owners and company.
Sunday, September 16, 2007
GcStar - managing personal collection items
Here's another graphical tool for managing your personal collections item in Linux.
GCStar is a nice item management and GNOME based graphical application linux tool. Current version of GcStar supports management of the following items:
a. numismatic,
b. books,
c. music,
d. videos games and
e. movies
GCStar supports many features for database manangement application such as item search and query, item addition and deletion, item and user history logs items, language and display options, borrowers and lending user data and more. Gcstar presents these data in a nice user-friendly environment even grandma can handle them easily.
GcStar provides more details related to but not limited to:
a. Collections management
b. Creation of user models
c. Filtering
d. Borrowings management
e. Conversions
g. Data and item management
GCStar man says:
GCstar is an application for managing your personal collections. Detailed information on each item can be automatically retrieved from the internet and you can store additional data, depending on the collection type. And also who you've lent your them to. You may also search and filter your collection by criteria.
GCSTAR INSTALLATION
===================
GCStar makes use of some Perl libraries. Yum is capable of installing these perl libraries as GCStar dependencies. Simply
# yum -y install gcstar
Installation location are categorized from the following folder locations:
1. /usr/bin - GCstar executables
2. /usr/lib/gcstar - GCStar libraries
3. /usr/share/gcstar - GStar docs and images
GCSTAR APPLICATION LAUNCHER
===========================
# gcstar
Initial Program Launch ScreenShot
~~~~~~~~~~~~~~~~~~~~~~~~~~~~~~~~~

Webshot:
Gcstar is a desktop item management and personal collection tool and management to keep.
Saturday, September 15, 2007
DStat - resource statistics linux tool
DStat is a versatile replacement for vmstat, iostat, netstat and ifstat. Dstat overcomes some of their limitations and adds some extra features, more counters and flexibility. Dstat is handy for monitoring systems during performance tuning tests, benchmarks or troubleshooting.
Dstat allows you to view all of your system resources instantly, you can eg. compare disk usage in combination with interrupts from your IDE controller, or compare the network bandwidth numbers directly with the disk throughput (in the same interval).
Dstat gives you detailed selective information in columns and clearly indicates in what magnitude and unit the output is displayed. Less confusion, less mistakes.
DStat features lifted from site based from
* Combines vmstat, iostat, ifstat, netstat information and more
* Shows stats in exactly the same timeframe
* Enable/order counters as they make most sense during analysis/troubleshooting
* Modular design
* Written in python so easily extendable for the task at hand
* Easy to extend, add your own counters (please contribute those)
* Includes about 10 external plugins to show how easy it is to add counters
* Can summarize grouped block/network devices and give total numbers
* Can show interrupts per device
* Very accurate timeframes, no timeshifts when system is stressed
* Shows exact units and limits conversion mistakes
* Indicate different units with different colors
* Show intermediate results when delay > 1
* Allows to export CSV output, which can be imported in Gnumeric and Excel to make graphs
DSTAT INSTALLATIN:
==================
As with any other linux tool from Fedora, DStat can be easily installed using yum like so
# yum -y install dstat
DSTAT BINARY LAUNCH
===================
# dstat -t -fa
My DStat screenshot in action:
Additionally, since Dstat supports generating stats directed to an output file, this logically means that DStat can be more useful when combined and launched within crontab utility.
Launching Dstat from crontab job provides another way on setting a new task for gathering top N resource statistics dumped by DStats to a file. Thus, we can generate report and long term statistical data from it done on chosen regular monthly or weekly basis, which can then be feed to MRTG config file for further server resource data graph.
Using DStat when properly used, enhances our server I/O capacity, load and server resource planning to scrutinize and analyze which point of time, time of the day, day of the week, and/or day of the month usually our linux box becomes more and/or less busy in terms of this resource statistical values dumped by DStats from regular point of interval time via cronjob.
FINAL NOTE:
-----------
Linux monitoring tools comes in many variety shapes and features, they are all created for specific task, just waiting for us to make use of it.
HTH
Might be interested kicking black boxes, thanks Joe.
Bandwidth Monitor-NG - terminal-based interface bandwidth monitoring tool
Here's another simple terminal-based tool for monitoring network interface and disk I/O ;ove bandwidth. This tool is currently available from Fedora yum repos.
Bandwidth Monitor NG (BMW-NG) network interface monitoring tool supports displaying TX/RX statistics of your network interface via terminal.
Besides from using other web-based linux monitoring and graphing tool, this bandwidth monitoring tool can be handy on linux boxes serving as internet gateway or acting as network proxy server of your network. Using this bandwidth monitoring tool, real-time internet and network bandwidth (TX/RX) consumption and usage can easily be displayed from your terminal session.
If you have a remote server and you wish to monitor per second real-time TX/RX statistics of your network interfaces and internet bandwidth of your linux gateway/proxy server, this bmw-ng fits perfectly into this scenario.
This bandwidth monitoring tool is capable also of generating network bandwidth statistic and dumps them either to text or HTML page for your further reading and reference.
Bandwidth Monitor NG (BWM-NG) is a small and simple console-based live network and disk I/O bandwidth monitoring tool for Linux, BSD, Solaris, Mac OS X and others.
BMW-NG major features lifted from site. These features are based from BW-NG 0.6 version.
* supports /proc/net/dev, netstat, getifaddr, sysctl, kstat, /proc/diskstats
/proc/partitions, IOKit, devstat and libstatgrab
* unlimited number of interfaces/devices supported
* interfaces/devices are added or removed dynamically from list
* white-/blacklist of interfaces/devices
* output of KB/s, Kb/s, packets, errors, average, max and total sum
* output in curses, plain console, CSV or HTML
* configfile
Bandwidth Monitoring Tool (BWM-NG) INSTALLATION
==============================================
# yum -y install bwm-ng
Application Launch:
# bwm-ng
BMW-NG screenshot in action:
KNemo - KDE network interface monitoring tool
Here's a KDE-based netwok interface monitoring tool similar to the one found in Windows. For every network interface from your linux box, KNemo displays network interface as icons from your desktop system tray using QT graphical interface.
KNemo displays for every network interface an icon in the systray. Tooltips and an info dialog provide further information about the interface. Passive popups inform about interface changes. A traffic plotter is also integrated. Knemo polls the network interface status every second using the ifconfig, route and iwconfig tools.
Knemo features lifted from site:
Features of version 0.4.5 include:
* support for ethernet (including wireless) and ppp connections
* the icon shows incoming/outgoing traffic
* hiding of icon when the interface is not available
* hiding of icon when the interface does not exist (useful for interfaces that
are dynamically created and and removed)
* automatic detection of wireless extensions for ethernet interfaces
* left-clicking on an icon displays a status dialog with information about the
selected interface (2nd click hides dialog)
* middle-clicking on an icon displays a traffic plotter that was taken from
KSysGuard (2nd click hides dialog)
* configuration via context menu or control center module (Internet & Network/
Network Monitor)
* customizable tooltip for quick access to often needed information
* custom entries in the context menu. Useful to start/stop/restart interfaces
or to configure them using external tools.
* automatic detection of available interfaces (click on 'Default' in the
configuration dialog and KNemo will look under /proc/net/dev for interfaces)
* support for notifications via sound and passive popups
* KNemo counts the number of transfered bytes and does not depend on the output
of 'ifconfig' for the total number of transfered bytes. This way KNemo can
even display a hugh amount of traffic while 'ifconfig' has an overflow at 4GB.
* support for different iconsets for every interface
* support for daily, monthly and yearly statistics
* configurable update interval for interface informations
* support for different backends to gather information
KNEMO INSTALLATION
===================
Knemo network monitoring tool can be installed using yum as follows:
# yum -y instal knemo
KNEMO APPLICATION LAUNCHER:
===========================
KNemo has to be started using KDE Control Center/Internet & Network/Network Monitor.
See how KNemo is being launched using KDE Control Center shown below.
Here's a sample KNemo screenshot showing my current network interface statistics. Knemo allows total control of data and statistics that can be shown using Knemo via KDE Control Center. See sample network stats below:
All trademarks and commercial title mentioned here are property and managed by their own company.
EtherApe - graphical network activity monitoring tool
There are times we need to monitor and analyze ongoing network traffic that passes from our current network and display it graphically in real-time mode from our GNOME desktop.
Here's another network activity monitoring tool available from Linux that can display current network connectivity links, traffic broadcast and network activities displayed in graphical mode using varying feature of colors, circle shapes, graphical link width and sizes from source to target traffic hosts.
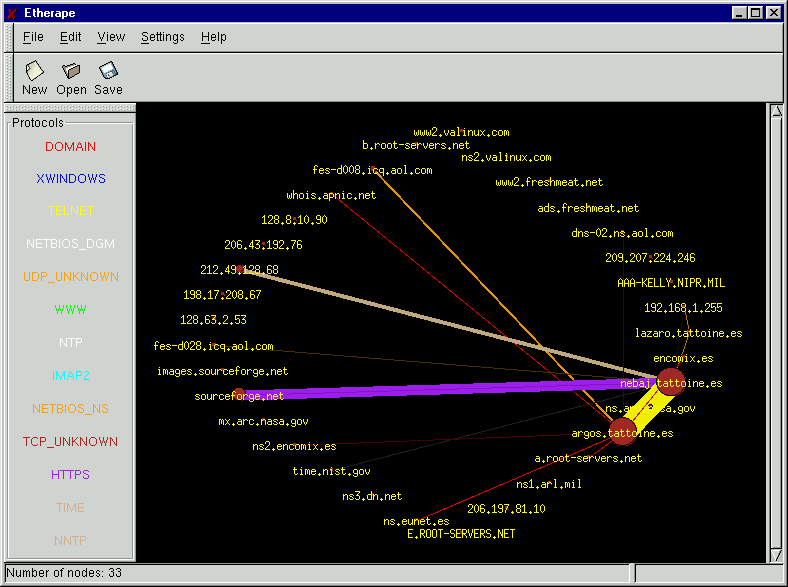
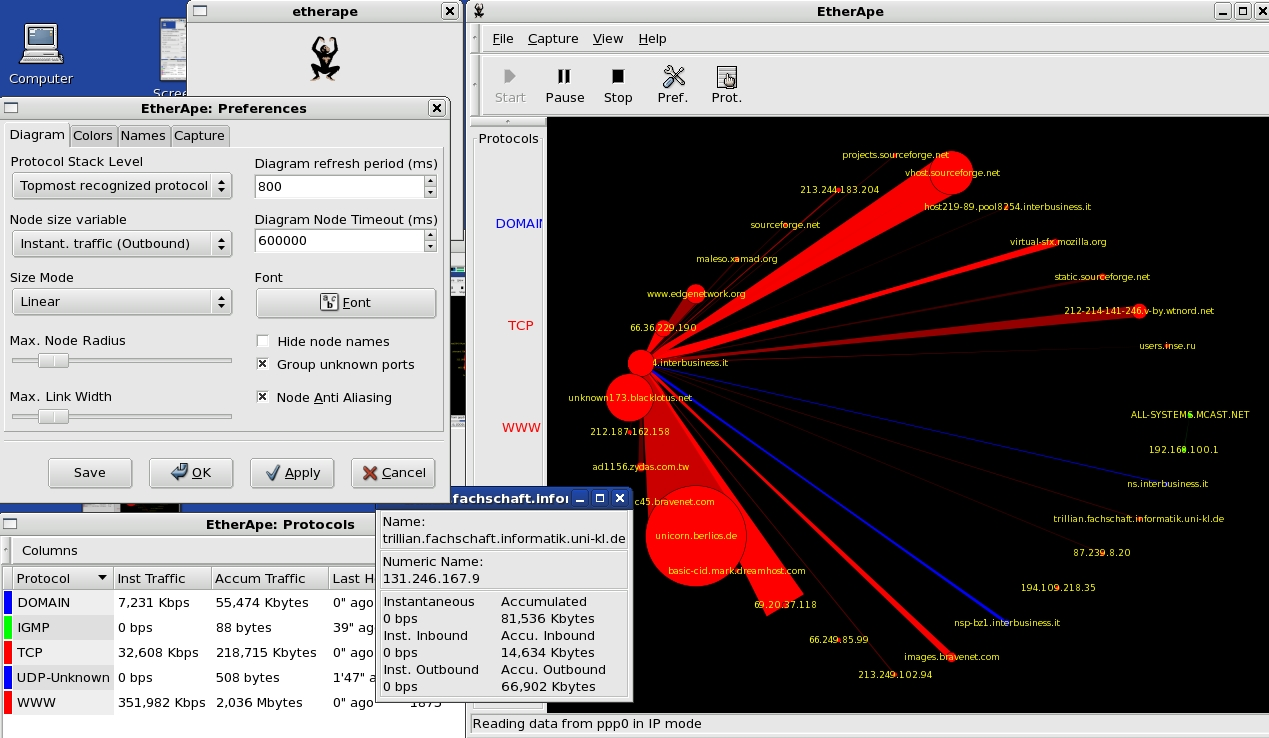
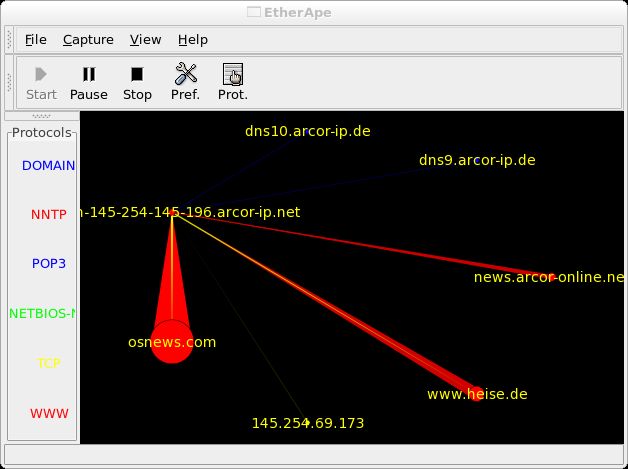
Etherape is GNOME bases network monitong linux application that uses colors, link sizes and width on displaying network activity from source host to target host within a network. Etherape was created and modeled after etherman, another network monitoring linux tool.
EtherApe is a graphical network monitor for Unix modeled after etherman. Featuring link layer, ip and TCP modes, it displays network activity graphically. Hosts and links change in size with traffic. Color coded protocols display.
It supports Ethernet, FDDI, Token Ring, ISDN, PPP and SLIP devices. It can filter traffic to be shown, and can read traffic from a file as well as live from the network.
At the present time, EtherApe has enough functionality to be useful, but it's far from complete. It's still beta software, and new features and bug fixes are being added all the time. Here is the list of features, current as of version 0.9.5, in no particular order:
* Network traffic is displayed graphically. The more "talkative" a node is, the bigger its representation.
* Node and link color shows the most used protocol.
* User may select what level of the protocol stack to concentrate on.
* You may either look at traffic within your network, end to end IP, or even port to port TCP.
* Data can be captured "off the wire" from a live network connection, or read from a tcpdump capture file.
* Live data can be read from ethernet, FDDI, PPP and SLIP interfaces.
* The following frame and packet types are currently supported: ETH_II, 802.2, 803.3, IP, IPv6, ARP, X25L3, REVARP, ATALK, AARP, IPX, VINES, TRAIN, LOOP, VLAN, ICMP, IGMP, GGP, IPIP, TCP, EGP, PUP, UDP, IDP, TP, IPV6, ROUTING, RSVP, GRE, ESP, AH, ICMPV6, EON, VINES, EIGRP, OSPF, ENCAP, PIM, IPCOMP, VRRP; and most TCP and UDP services, like TELNET, FTP, HTTP, POP3, NNTP, NETBIOS, IRC, DOMAIN, SNMP, etc.
* Data display can be refined using a network filter.
* Display averaging and node persistence times are fully configurable.
* Name resolution is done using standard libc functions, thus supporting DNS, hosts file, etc.
* Clicking on a node/link opens a detail dialog showing protocol breakdown and other traffic statistics.
* Protocol summary dialog shows global traffic statistics by protocol.
* Scrollkeeper-compatible manual.
ETHERAPE INSTALLATION:
=======================
Etherape is available from Fedora 7 yum repos. Etherape network activity monitoring tool can be installed using yum as follows
# yum -y install etherape
ETHERAPE PROGRAM LAUNCH:
~~~~~~~~~~~~~~~~~~~~~~~~~~~~~~~~~~
Ctrl+F2, etherape
ETHERAPE WEB SCREENSHOT IN ACTION:
~~~~~~~~~~~~~~~~~~~~~~~~~~~~~~~~~~
FINAL NOTE:
~~~~~~~~~~~~
Monitoring network traffic and hosts gives us better opportunity to further study and analyze several network issues, that maybe unknown to us, such as most broadcasting host, most busiest network host, source and target hosts of current network congestion, network activities of current time of the day and more. These network usage data gathering can lead us to further isolation of solving network congestion and latency issues. Furthermore, keeping records of these network statistics leads us to a deeper strategical network capacity planning, faster host traffic source and target isolation that probably cause network congestion and internal latency issues. Better to have these network activity monitoring tool that can be handy when needed.
Friday, September 14, 2007
Beauty of Math using Linux
This evening, I received an email showing me several beauty of math numbers, that fascinated me.
This email of Beauty of Math Numbers is not really related to my linux blog. However, my attempt for tracing the DNA relation of this beauty of math numbers to linux family genes has been successful for the past few minutes and I would like to share it here.
A set of number patterns will be shown one at a time and I would try to achieve the same effect using simple bash scripting as we move along live.
I have to copy and paste from the email that I received.
Here goes the first contestant of the Beauty of Math in Linux.
1 x 8 + 1 = 9
12 x 8 + 2 = 98
123 x 8 + 3 = 987
1234 x 8 + 4 = 9876
12345 x 8 + 5 = 98765
123456 x 8 + 6 = 987654
1234567 x 8 + 7 = 9876543
12345678 x 8 + 8 = 98765432
123456789 x 8 + 9 = 987654321
See the pretty number patterns above?
Now here's goes my freshly made linux bash script to achieve the same mathematical computation and match display shown above:
~~~~~~~~~~~~~~~~~~~~~~~~~~~~~~~~~~~~~~~~~~~~~~~~~~~~~~~~~~~~~
#/bin/bash
x=1
constant=8
array=(1 12 123 1234 12345 123456 1234567 12345678 123456789)
while [ $x -lt 10 ] ;
do
let product=${array[$x-1]}*$constant+$x
echo ${array[$x-1]} x $constant + $x = $product
let x=$x+1;
done
~~~~~~~~~~~~~~~~~~~~~~~~~~~~~~~~~~~~~~~~~~~~~~~~~~~~~~~~~~~~~
Screen Output:
1 x 8 + 1 = 9
12 x 8 + 2 = 98
123 x 8 + 3 = 987
1234 x 8 + 4 = 9876
12345 x 8 + 5 = 98765
123456 x 8 + 6 = 987654
1234567 x 8 + 7 = 9876543
12345678 x 8 + 8 = 98765432
123456789 x 8 + 9 = 987654321
~~~~~~~~~~~~~~~~~~~~~~~~~~~~~~~~~~~
Now, the second contestant for the Beauty of Math using Linux bash scripting.
1 x 9 + 2 = 11
12 x 9 + 3 = 111
123 x 9 + 4 = 1111
1234 x 9 + 5 = 11111
12345 x 9 + 6 = 111111
123456 x 9 + 7 = 1111111
1234567 x 9 + 8 = 11111111
12345678 x 9 + 9 = 111111111
123456789 x 9 +10= 1111111111
And here's my equivalent bash script for that
~~~~~~~~~~~~~~~~~~~~~~~~~~~~~~~~~~~~~~~~~~~~~~~~~~~~~~~~~~~~~
#/bin/bash
x=2
constant=9
array=(1 12 123 1234 12345 123456 1234567 12345678 123456789)
while [ $x -lt 11 ] ;
do
let product=${array[$x-2]}*$constant+$x
echo ${array[$x-2]} x $constant + $x = $product
let x=$x+1;
done
~~~~~~~~~~~~~~~~~~~~~~~~~~~~~~~~~~~~~~~~~~~~~~~~~~~~~~~~~~~~~
Output:
1 x 9 + 2 = 11
12 x 9 + 3 = 111
123 x 9 + 4 = 1111
1234 x 9 + 5 = 11111
12345 x 9 + 6 = 111111
123456 x 9 + 7 = 1111111
1234567 x 9 + 8 = 11111111
12345678 x 9 + 9 = 111111111
123456789 x 9 + 10 = 1111111111
~~~~~~~~~~~~~~~~~~~~~~~~~~~~~~~~~~~
Now, the third contestant from the Beauty of Math in Linux:
9 x 9 + 7 = 88
98 x 9 + 6 = 888
987 x 9 + 5 = 8888
9876 x 9 + 4 = 88888
98765 x 9 + 3 = 888888
987654 x 9 + 2 = 8888888
9876543 x 9 + 1 = 88888888
98765432 x 9 + 0 = 888888888
which has an equivalent bash script code shown below:
~~~~~~~~~~~~~~~~~~~~~~~~~~~~~~~~~~~~~~~~~~~~~~~~~~~~~~~~~~~~~
#/bin/bash
x=7
y=0
constant=9
array=(9 98 987 9876 98765 987654 9876543 98765432)
while [ $y -lt 8 ] ;
do
let product=${array[$y]}*$constant+$x
echo ${array[$y]} x $constant + $x = $product
let x=$x-1;
let y=$y+1;
done
~~~~~~~~~~~~~~~~~~~~~~~~~~~~~~~~~~~~~~~~~~~~~~~~~~~~~~~~~~~~~
Equivalent screen output:
9 x 9 + 7 = 88
98 x 9 + 6 = 888
987 x 9 + 5 = 8888
9876 x 9 + 4 = 88888
98765 x 9 + 3 = 888888
987654 x 9 + 2 = 8888888
9876543 x 9 + 1 = 88888888
98765432 x 9 + 0 = 888888888
~~~~~~~~~~~~~~~~~~~~~~~~~~~~~~~~~~~
Brilliant isn't it?
Now, take a look at this next math symmetry.
1 x 1 = 1
11 x 11 = 121
111 x 111 = 12321
1111 x 1111 = 1234321
11111 x 11111 = 123454321
111111 x 111111 = 12345654321
1111111 x 1111111 = 1234567654321
11111111 x 11111111 = 123456787654321
111111111 x 111111111= 12345678987654321
Here goes its equivalent bash script for the above patterns:
~~~~~~~~~~~~~~~~~~~~~~~~~~~~~~~~~~~~~~~~~~~~~~~~~~~~~~~~~~~~~
#/bin/bash
x=0
array=(1 11 111 1111 11111 111111 1111111 11111111 111111111)
while [ $x -lt 9 ] ;
do
let product=${array[$x]}*${array[$x]}
echo ${array[$x]} x ${array[$x]} = $product
let x=$x+1;
done
~~~~~~~~~~~~~~~~~~~~~~~~~~~~~~~~~~~~~~~~~~~~~~~~~~~~~~~~~~~~~
which has an equivalent terminal output:
~~~~~~~~~~~~~~~~~~~~~~~~~~~~~~~~~~~~~~~~~~~~~~~~~~~~~~~~~~~~~~~~~~~~~~
1 x 1 = 1
11 x 11 = 121
111 x 111 = 12321
1111 x 1111 = 1234321
11111 x 11111 = 123454321
111111 x 111111 = 12345654321
1111111 x 1111111 = 1234567654321
11111111 x 11111111 = 123456787654321
111111111 x 111111111 = 12345678987654321
~~~~~~~~~~~~~~~~~~~~~~~~~~~~~~~~~~~~~~~~~~~~~~~~~~~~~~~~~~~~~~~~~~~~~~
Numerical Final Note:
~~~~~~~~~~~~~~~~~~~~
Numbers are interesting human-made and human-readable values that makes us real busy these computing days.
Any ideas who won this Beauty of Match Linux contest?
PS
Oh, I wonder how my black coffee with brandy (scotch coffee) helps me interpret these numbers into its equivalent bash script somehow.
Hope you enjoy reading them, cheers!
print leading/trailing lines before/after a matching string
Usually all mail log files specially SendMail, Qmail and Postfix, generates multi-lines of mail log files into its default log file. That is, a message line is being dumped to a log file from the time of a client's connection up to client's disconnection, there are already several lines dumped to its default mail log file, say /var/log/maillog.
Now, say we want to print a few lines before and after a matching string is found, here's a quick way of accomplishing this task using grep.
Grep can display leading and trailing lines before a string match is found.
Here's a quick way to do it.
# cat testfile.txt
~~~~~~~~~~~~~~~~~~~~
123
456
678
Linux SysAd Blog
abc
def
ghi
~~~~~~~~~~~~~~~~~~~~
Now, let us try to print leading lines before a match to 'linux' string is found using grep.
# grep -B 2 Linux testfile.txt
output:
~~~~~~~~~~~~~~~~~~~~
456
678
Linux SysAd Blog
~~~~~~~~~~~~~~~~~~~~
The above comamnd displays 2 leading lines before the matched string.
Alternatively, let us print 2 trailing lines after a match is found. This can be done like so
# grep -A 2 Linux testfile.txt
Output:
~~~~~~~~~~~~~~~~~~~~
Linux SysAd Blog
abc
def
~~~~~~~~~~~~~~~~~~~~
As you can see, a specified number of trailing lines before the search string 'Linux' .
MORE GREP APPLICATION
~~~~~~~~~~~~~~~~~~~~~~
You can also apply this to commented text file. In a large commented config files, usually putting a marker string is helpful on editing large files. The above commands can be handy if you wish to view those trailing and leading lines before that marker string.
# cat testfile.cfg
~~~~~~~~~~~~~~~~~~~~~~~~~~~~~~~~~~~~~~~~~
#
# ..
# Two thousand config and commented lines before the next line
#
# here goes my marker string
# CHECK1
#
# here goes the actual config line
value1 = 1
value2 = 2
#
# another thousand config lines.
#
~~~~~~~~~~~~~~~~~~~~~~~~~~~~~~~~~~~~~~~~~
Without using an editor, grep can easily display lines of value1 and value2 using CHECK1 as my string marker.
Final Note
~~~~~~~~~~
Grep saves time and effort on handling these type of grep searching.
HTH
Thanks for today's support!
Nagios Monitoring - install and generic setup howto
A lot of powerful monitoring tools are freely available from linux world. One of them is Nagios.
Nagios is a fairly complex linux monitoring tool that determines current status of target host or equipment. Two good things about Nagios is that Nagios supports web-enabled administration page and user view-only mode account. The other one is that Nagios' task can be expanded variably using extended plugins and addons for Nagios.
This blog entry covers how to install and configure Nagios binary package from a Fedora box and make it act as part of a monitoring utility server for polling device status.
Nagios web pages says:
Nagios is a host and service monitor designed to inform you of network problems before your clients, end-users or managers do. It has been designed to run under the Linux operating system, but works fine under most *NIX variants as well. The monitoring daemon runs intermittent checks on hosts and services you specify using external "plugins" which return status information to Nagios. When problems are encountered, the daemon can send notifications out to administrative contacts in a variety of different ways (email, instant message, SMS, etc.). Current status information, historical logs, and reports can all be accessed via a web browser.
Here's how to install Nagios and Nagios-Plugins using yum
NAGIOS INSTALLATION
===================
The default nagios installation can be done by doing like so
# yum -y install nagios
This linux blog entry would only cover Nagios setup and installation aimed to generate a long-term uptime/downtime graph status of host and device based on ICMP echo replies sent against the target host IP address.
If you wish to install more Nagios plugins and addons.
# yum -y install nagios-plugins nagios-plugins-all
Additional Nagios Plugins
==========================
There are more Nagios addons and plugins available for downloads using yum. To name a several Nagios plugins and addons:
a. nagios-plugins-pqsql
b. nagios-plugins-ntp
c. nagios-plugins-ping
d. nagios-plugins-dns
e. nagios-plugins-disk
f. nagios-plugins-udp
g. nagios-plugins-mrtg
h. nagios-plugins-dig
i. nagios-plugins-log
j. nagios-plugins-dhcp
k. nagios-plugins-sensors
l. nagios-plugins-http
m. nagios-plugins-ups
n. nagios-plugins-rpc
o. nagios-plugins-game
p. nagios-plugins-icmp
q. nagios-plugins-real
r. nagios-plugins-nt
s. nagios-plugins-swap
t. nagios-plugins-overcr
u. nagios-plugins-tcp
v. nagios-plugins-users
w. nagios-plugins-mysql
x. nagios-plugins-ldap
y. nagios-plugins-perl
z. nagios-plugins-ide_smart
and a lot more!
Nagios Default Folder Locations
================================
By default Nagios yum installation, Nagios stores the following file location into your harddisk
a. /etc/nagios/ - Nagios configuration folder locations
b. /var/log/nagios/ - Nagios log and messages folder locations
c. /usr/share/nagios/ - Nagios, docs, sounds, and image folder locations
d. /usr/lib/nagios/cgi-bin/ - Nagios CGI folder location
e. /usr/bin - Nagios binaries
f. /etc/httpd/conf.d/ - Nagios Apache folder files
g. /etc/logrotate.d/nagios/ - Nagios log rotation file
As a blog entry example, I am going to take a sample of creating uptime/downtime graph say one of my remote broadband router with an IP address of 123.123.123.123 located remotely.
To create a Nagios configuration for this device and IP address, follow these simple steps.
# cd /etc/nagios/
do your backup kungfu
# cp nagios.cfg-sample nagios.cfg
# cp localhost.cfg-sample localhost.cfg
# cp cgi-cfg-sample cgi-cfg.cfg
# cp commands.cfg-sample commands.cfg
With old version of Nagios, Nagios configuration files are being stored separately. This separate config files refers to nagios functions, nagios services, nagios target host and nagios users. The recent Nagios rpm package version makes it more easy to configure Nagios configuration file.
A simple generic template can now be edited in less than three files assuming a basic Nagios setup with default Nagios feature values on RedHat-based distro like Fedora.
Sample Nagios Generic Template
==============================
Here's a generic basic template for that.
~~~~~~~~~~~~~~~~~~~~~~~~~~~~~~~~~~~~~~~~~~~~~~~~~~~~~~~~~~~~~~~~~~~~~~~~~~~~~~~~~
define host{
name DEVICE-NAME
use generic-host
check_period 24x7
max_check_attempts 10
check_command check-host-alive
notification_period workhours
notification_interval 120
notification_options d,u,r
contact_groups admins
register 0
}
define host{
use DEVICE-NAME
host_name DEVICE-NAME
alias DEVICE-NAME
address REMOTE-DEVICE-IP-ADDRESS
}
define service{
use local-service
host_name DEVICE-NAME
service_description PING
check_command check_ping!100.0,20%!500.0,60%
}
~~~~~~~~~~~~~~~~~~~~~~~~~~~~~~~~~~~~~~~~~~~~~~~~~~~~~~~~~~~~~~~~~~~~~~~~~~~~~~~~~
You can edit DEVICE-NAME to refer to group name of selected set of host with similar function. Say your FQDN name for a router is Gateway1.google.com , you can replace DEVICE-NAME and change it to Gateway1. Following the pattern, REMOTE-DEVICE-IP-ADDRESS can be replaced by a reachable host or device IP address.
More legends are shown below:
~~~~~~~~~~~~~~~~~~~~~~~~~~~~~~~~~~~~~~~~~~~~~~~~~~~~~~~~~~~~~~~~~~~~~~~~~~~~~~~~~~~~~~
a. DEVICE-NAME - reference name for the target device or equipment that would appear from graph
b. REMOTE-DEVICE-IP-ADDRESS - the IP address of remote device or host being monitored
~~~~~~~~~~~~~~~~~~~~~~~~~~~~~~~~~~~~~~~~~~~~~~~~~~~~~~~~~~~~~~~~~~~~~~~~~~~~~~~~~~~~~~
This generic template should be inserted or appended into your /etc/nagios/localhost.cfg file.
As an example reference, I am assuming a default Nagios time period interval given from default config of its /etc/localhost.cfg in Nagios polling interval time. You may alter this time interval pattern that may fit your own GMT. If you decided to change the Nagios polling interval, this would affect how the device would be drawn to graph as well.
See a basic sample of Nagios polling interval below. The timeperiod is tagged as nonworkhours as shown:
~~~~~~~~~~~~~~~~~~~~~~~~~~~~~~~~~~~~~~~~~~~~~~~~~~~
define timeperiod{
timeperiod_name nonworkhours
alias Non-Work Hours
sunday 00:00-24:00
monday 00:00-09:00,17:00-24:00
tuesday 00:00-09:00,17:00-24:00
wednesday 00:00-09:00,17:00-24:00
thursday 00:00-09:00,17:00-24:00
friday 00:00-09:00,17:00-24:00
saturday 00:00-24:00
}
~~~~~~~~~~~~~~~~~~~~~~~~~~~~~~~~~~~~~~~~~~~~~~~~~~~
Now, proceed on creating a host group for that particular router.
Say for example, if you have 10 Ciscos router and 10 Non-Ciscos router, you can reference them with a single group name of Network-A
-Routers or Routers alone.
From /etc/nagios/localhost, find the line that says:
~~~~~~~~~~~~~~~~~~~~~~~~~~~~~~~~~~~~~~~~~~~~~~~
define hostgroup{
hostgroup_name DEVICE-NAME-GROUP-ALIAS
alias DEVICE-NAME-GROUP
members DEVICE-NAME
}
~~~~~~~~~~~~~~~~~~~~~~~~~~~~~~~~~~~~~~~~~~~~~~~
and edit the BOLD characters shown above.
For reference:
~~~~~~~~~~~~~~~~~~~~~~~~~~~~~~~~~~~~~~~~~~~~~~~~~~~~~~~~~~~~~~~~~~~~~~~~~~~~~~~~~~~~~~~~~~
DEVICE-NAME-GROUP-ALIAS - Refers to the group alias
DEVICE-NAME-GROUP - Refers to group name. If you have say 10 routers, you can refer them
by this categorical group name. There are features in Nagios that
shows host or device sorted and shown in group name or alias
DEVICE-NAME - Refers to device or target host identity name in Nagios
~~~~~~~~~~~~~~~~~~~~~~~~~~~~~~~~~~~~~~~~~~~~~~~~~~~~~~~~~~~~~~~~~~~~~~~~~~~~~~~~~~~~~~~~~~
NAGIOS CONFIG VERIFICATION
==========================
For sanity checking, make sure you verify Nagios config files. This can be done like so
# nagios -v /etc/nagios/nagios.cfg
The above command would show you for any erroneous lines frin Nagios config file.
NAGIOS LINUX SERVICE
==========================
Basically, at this point of basic Nagios configuration, restarting Nagios should be successful.
Reload your apache service together with your Nagios service like so
# service httpd restart
# service Nagios stop
# service Nagios start
# service Nagios status
Nagios Further Configuration
============================
If you wish to customize more of the basic config shown above, continue editing /etc/nagios/localhost. Find these lines
~~~~~~~~~~~~~~~~~~~~~~~~~~~~~~~~~~~~~~~~~~~~~~~~~~~~~~~~~~~~~~~~~~~~~~
define contact{
contact_name nagios-admin
alias Nagios Admin
service_notification_period 24x7
host_notification_period 24x7
service_notification_options w,u,c,r
host_notification_options d,r
service_notification_commands notify-by-email
host_notification_commands notify-by-email
email YOUR-EMAIL-ADDR
}
~~~~~~~~~~~~~~~~~~~~~~~~~~~~~~~~~~~~~~~~~~~~~~~~~~~~~~~~~~~~~~~~~~~~~~
Legend:
YOUR-EMAIL-ADDR refers to admin's email address if you wish to receive email alerts.
If you wish to change more of Nagios default configuration setup files, this can be done by editing /etc/nagios/nagios.cfg file.
Besides from an extensible feature of Nagios having more plugins and addons, Nagios can also be configured to produce audio, SMS and email alerts for proactive response from admins.
Additionally, Nagios config files comes with helpful tips and comments inserted before the actual Nagios config lines. This is highly noticeable from nagios.cfg and localhost.cfg Nagios files as well.
Remember to verify all your Nagios config files before restarting the Nagios service.
And finally, point your browser to Nagios page. By default, it should be located from your apache root folder, say /var/www/html/nagios, the interface would be http://yourdoma.com/nagios/
Congratulations for browsing your Nagios page!
NAGIOS ADDITIONAL SECURITY
==========================
For additional package security, username and password authentication mechanism is highly supported by Apache config files. This mechanism also includes IP address access list. Being paranoid admin and enabling HTTPS would also enhance Nagios restrictions with Apache.
Launching Nagios daemon as normal nagios user is advisable as well. This can be changed from nagios.cfg file.
Unfortunately, further security with apache would not be covered here.
See my nagios screenshots in action:


Hope this helps and have a nice weekend!

Make Money


Live Traffic
